Freight Rate Benchmarks 2026: Is Your Quote Actually Fair?
A fair freight quote in 2026 depends on lane, mode, haul length, fuel, and accessorials. This guide shows how to normalize rates, spot when 10% above market matters, and decide whether to renegotiate or audit.
Freight Rate Benchmarks 2026: What a Fair Quote Actually Looks Like
A fair freight rate in 2026 reflects the market-appropriate price for your specific lane, mode, equipment, and service level, not the lowest number on a bid sheet. Raw per-mile or per-CWT comparisons only mean something once you normalize for haul length, direction, region, and surcharge structure. Skip that step and a rate that looks 15% cheaper on paper can still be the worse deal once fuel and accessorials get added back in.
That gap is what this article works through. Instead of handing you one national average and calling it a benchmark, the sections below walk through how to take one live quote and normalize it against real 2026 ranges by haul length, freight class, and region, then decide whether what you're paying is fair, inflated, or just misunderstood.
What Is Freight Rate Benchmarking, and Why Three Quotes Aren't Enough?
Freight rate benchmarking is the systematic comparison of what you actually pay carriers against current market rates for the same lanes, modes, weight breaks, and service levels. A real benchmark also checks fuel surcharges, accessorials, and carrier reliability against quoted transit times, not just the base rate.
Collecting three quotes and picking the cheapest feels like benchmarking. It isn't. The three-quote approach only answers "what are these carriers willing to charge me today," not "what are other shippers paying for the same movement." A carrier quoting $100 below its next competitor could still be $300 above what a high-volume shipper negotiated on the identical lane last month. You have no way to know that from quotes alone, only from a market benchmark.
Spot Rate vs Contract Rate: What's the Difference for Freight Pricing?
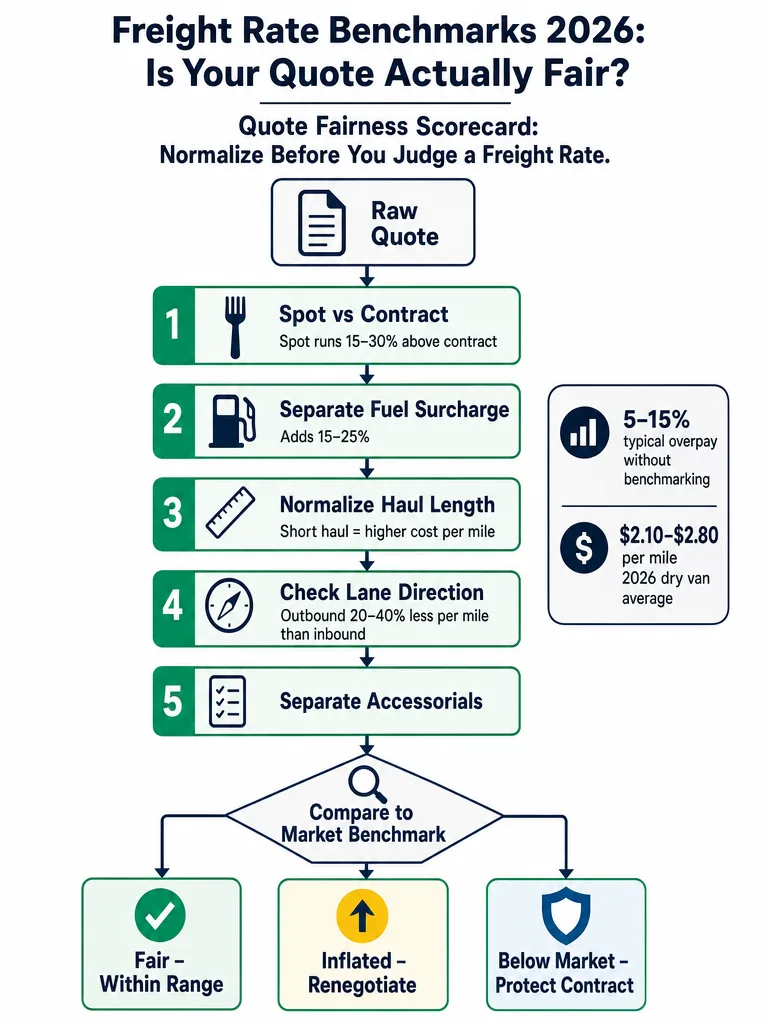
Spot rates and contract rates answer different questions, and comparing one against the other produces a false benchmark. A spot rate is what a carrier charges for a single, unplanned shipment booked against available capacity right now. A contract rate is the negotiated price locked in for a defined volume commitment over a set period. Industry benchmarking data for 2026 puts spot rates running 15–30% above contract in tight capacity markets.
That spread means a shipper without a contract is paying a structural premium on every load moved outside a committed agreement, not just an occasional bad rate.
| Rate type | How it's set | 2026 behavior |
|---|---|---|
| Spot | Priced against available capacity for a single load | Runs 15–30% above contract in tight markets; can swing 20–30% within a single quarter |
| Contract | Negotiated for committed volume over a fixed period | Fixed for the term, but can drift below or above market as conditions shift after signing |
Benchmark spot against spot and contract against contract. Mixing the two into one "average rate" tells you nothing useful about either.
How Do You Benchmark Your Freight Lane Rates, Step by Step?
Benchmarking one quote correctly means normalizing it on the same basis as the market data you're comparing it to, not just eyeballing the total. The most reliable freight benchmarking practice starts with a broader check before you ever get to lane math: measure freight cost as a percentage of sales first, since raw per-lane comparisons mislead unless you're comparing organizations of similar size, geography, and order profile.
From there, the lane-level work follows a fixed sequence:
- Confirm the rate type. Separate spot quotes from contract quotes before comparing anything. A spot number benchmarked against a contract range will always look inflated.
- Match lane and mode exactly. A dry van FTL rate on a 600-mile Midwest lane isn't comparable to an LTL Class 125 shipment on the same corridor.
- Normalize for haul length. Short hauls carry higher per-mile costs than long hauls because fixed costs spread over fewer miles, so a $3.20/mi quote on a 400-mile lane may already be at market.
- Strip out the fuel surcharge. Fuel is additive on top of the linehaul rate and can add 15–25% depending on diesel prices and the carrier's own fuel schedule. Compare linehaul to linehaul, then fuel to fuel.
- Line up accessorials separately. Liftgate, residential delivery, and address correction fees vary by carrier and shouldn't get folded into a base-rate comparison.
- Check your rate structure against your shipment profile. If most of your freight moves as cartons but you negotiated pallet rates, the structure itself is mismatched, regardless of how competitive either number looks in isolation.
- Prioritize by volume and staleness. Start with your highest-volume lanes, highest-spend lanes, and any route that hasn't been competitively sourced recently, since that's where a mismatch compounds fastest.
Applying that sequence to one quote turns a gut call into a documented answer you can bring into a renegotiation.
2026 Per-Mile and Per-CWT Freight Rate Benchmarks by Haul Length and Class
Full truckload dry van rates in 2026 average $2.10 to $2.80 per mile by current industry benchmarking data, but that range only holds once you normalize by haul length. Shorter hauls run well above that average; longer hauls run below it, because fixed carrier costs spread over more miles.
| Haul length | Favorable market | Market rate | Tight capacity |
|---|---|---|---|
| Short haul (under 500 mi) | $2.50/mi | $3.20/mi | $4.20/mi |
| Medium haul (500–1,000 mi) | $2.10/mi | $2.60/mi | $3.40/mi |
| Long haul (1,000–2,000 mi) | $1.85/mi | $2.25/mi | $3.00/mi |
| Extra long haul (2,000+ mi) | $1.75/mi | $2.10/mi | $2.80/mi |
LTL doesn't price per mile. It prices per hundredweight (CWT), scaled by NMFC freight class. Approximate 2026 industry ranges by class:
| Freight class | Approximate rate per CWT |
|---|---|
| Class 50–70 | $8–$18 |
| Class 85–100 | $18–$35 |
| Class 125–175 | $35–$65 |
| Class 200–500 | $65–$150+ |
Mid-market shippers without benchmarking data typically overpay by 5–15% on individual lanes, a gap that compounds fast across a freight program of any real size. Fuel surcharges sit on top of every range above and are not included in the per-mile or per-CWT figures.
Why Your Lane Might Run Above Average and Still Be a Fair Deal
Region, direction, haul length, and border complexity all move the benchmark itself, so a rate above the national average isn't automatically an overcharge. Current 2026 regional benchmarking data shows how wide that swing gets. Northeast inbound lanes run 15–25% above the market average. West Coast inbound runs 20–35% above. Cross-border US-Mexico lanes run 40–80% over comparable domestic freight.
Direction matters as much as region. Outbound lanes moving into high-demand corridors typically cost 20–40% less per mile than inbound lanes moving from low-demand corridors into high-density markets, because carriers price the empty return leg into the rate they quote you.
Short-haul lanes look expensive on a per-mile basis for a structural reason, not a pricing failure: a 400-mile lane spreads a driver's fixed costs over fewer miles than a 1,800-mile lane, so its market rate benchmark sits higher by design.
Before flagging a quote as inflated, check it against the regional, directional, and haul-length benchmark for that exact lane, not the blended national average.
How Far Above Market Justifies Renegotiating, Rebidding, or Holding Your Contract?
Ten percent is the practical trigger point. A contracted rate more than 10% above the market reference on a high-volume lane is worth renegotiating. Below that threshold, the gap is often just normal market noise or a lane characteristic you haven't accounted for yet.
Volume changes the math. A 12% gap on a lane you move twice a year costs you little. The same 12% gap on your highest-volume corridor compounds into real money every month, which is why lane prioritization matters before you start renegotiating anything.
Timing matters too. Spot rates can move 20–30% within a single quarter in volatile markets. Ocean freight benchmarking guidance shows a similar pattern at contract level: market conditions can shift 20% in either direction within months of a contract being signed. Trucking and LTL contracts drift on a similar cycle, even if the size of the swing differs by mode, so treat a rate that was competitive at tender six months ago as unverified until you re-check it.
That cuts both ways. If your benchmark shows your current contract sitting below market, the move isn't to reopen pricing, it's to protect that rate and avoid a rebid that could reset you closer to the current, higher market level. Use the gap size and direction to decide your next move:
- Gap under 10%, high volume: hold and monitor next cycle.
- Gap over 10%, high volume: renegotiate now.
- Gap over 10%, low volume, stale contract: rebid the lane.
- Your rate below market: protect the contract, don't reopen it.
How Often Should You Re-Benchmark Freight Rates in 2026?
Annual rate reviews miss most of what actually moves freight markets. Capacity, demand, and geopolitical shifts don't pause between tender cycles, so a rate locked in during a favorable quarter can already be off market by the time your next annual review rolls around. Current freight benchmarking guidance recommends re-checking high-volume lanes at least quarterly for exactly this reason.
Broader freight procurement guidance lands in a similar place: semi-annual benchmarking with ongoing spot-checks, rather than a single annual look, catches rate drift before it compounds across a full year of invoices.
The practical rhythm that emerges: benchmark your highest-volume lanes every quarter, run a fuller review across your whole freight program twice a year, and treat any major market signal, a fuel spike, a capacity crunch, a new lane, as a trigger to check sooner.
Freight Rates vs Parcel Rates: Why the Benchmarking Playbook Differs
Freight benchmarking and small parcel benchmarking solve related problems with different math. Freight rates get normalized by lane, mode, haul length, and freight class. Parcel rates from UPS, FedEx, USPS, and DHL are priced by weight tier, zone, and dimensional weight, with surcharges layered on separately.
Public detail on parcel-specific 2026 rate benchmarks is limited in the freight-focused sources this article draws on, so the per-mile and per-CWT ranges above shouldn't be applied to parcel invoices directly. If your shipping mix includes small parcel volume alongside LTL or FTL freight, that side of your spend needs its own tier-and-surcharge review rather than a freight-style lane comparison. Freight and parcel deserve separate benchmarking passes even inside the same shipping budget.
How to Choose Between Renegotiating, Rebidding, or Auditing Your Invoices
The benchmark gap you find determines the move, not a general instinct to "get better rates." A base-rate benchmark tells you whether your negotiated price is fair. It doesn't tell you whether your carrier is actually billing you that price correctly, and those are two separate problems.
- Base rate within 10% of market: hold your current contract and re-benchmark next quarter.
- Base rate more than 10% above market, high volume: open a renegotiation with your benchmark data in hand.
- Contract stale or never competitively sourced: rebid the lane rather than renegotiate a contract that was never market-tested.
- Base rate looks fair but invoices feel high anyway: the gap is likely in billing, not the negotiated rate. Fuel surcharge miscalculations, accessorial misclassification, and rounding errors on the invoice can erase a good negotiated rate line by line.
That last case is where an invoice audit does work a rate benchmark can't. Kadima Logistics runs a free audit against real invoice data specifically to catch that gap, checking whether the rate you negotiated is the rate actually being billed across every UPS, FedEx, USPS, DHL, and Amazon Shipping invoice you have, before you spend time renegotiating a rate that was already fair.
If your benchmark shows a lane running above market and you're not sure whether the fix is a new rate or a billing audit, a written comparison of both usually settles it fast. See where your invoices stand with a free shipping audit from Kadima Logistics.
Frequently asked questions
What is freight rate benchmarking, and why isn't collecting three quotes enough?
Freight rate benchmarking compares what you actually pay carriers against current market rates for the same lane, mode, weight break, and service level, not just competing quotes. Three quotes only tell you what carriers are willing to charge today, not what other shippers pay for the same move. A carrier quoting $100 below a competitor's bid can still sit $300 above the rate a high-volume shipper negotiated on the identical lane.
What's the difference between spot and contract freight rates?
Spot rates are priced against available capacity for a single, unplanned shipment; contract rates lock in a price for a committed volume over a set period. Spot rates run 15-30% above contract rates in tight capacity markets in 2026, per industry benchmarking data. A shipper without a signed contract pays that premium on every load moved outside a negotiated agreement.
What's a fair per-mile rate for full truckload freight in 2026?
Market-rate dry van FTL rates in 2026 average $2.10 to $2.80 per mile, but the fair number depends on haul length. Short hauls under 500 miles run around $3.20/mi at market rate, while extra-long hauls over 2,000 miles run closer to $2.10/mi, because fixed carrier costs spread over more miles on longer routes. Fuel surcharges of 15-25% sit on top of these figures separately.
How far above market rate justifies renegotiating a freight contract?
10% above the market reference on a high-volume lane is the practical trigger for renegotiating. Below that threshold, the gap is usually normal market noise or a lane characteristic like haul length or direction that hasn't been accounted for. Volume matters too: a 12% gap on a lane moved twice a year barely matters, but that same gap on a top corridor compounds into real money every month.
Why does my freight rate look higher than the national average - is it still a fair deal?
A rate above the national average isn't automatically an overcharge, because region and direction move the benchmark itself. Northeast inbound lanes run 15-25% above market average, West Coast inbound runs 20-35% above, and cross-border US-Mexico lanes run 40-80% over comparable domestic freight in current 2026 data. Check a quote against the regional and directional benchmark for that exact lane before calling it inflated.
How often should you re-benchmark freight rates in 2026?
Quarterly for high-volume lanes, with a fuller review across the whole freight program twice a year. Annual reviews miss most of what moves freight markets, since capacity and demand shift constantly between tender cycles. Ocean freight benchmarking data shows market conditions can shift 20% in either direction within months of a contract being signed, and trucking and LTL contracts drift on a similar cycle.
Keep reading


One short note, every other Tuesday. Nothing else.
The patterns we're seeing across thousands of carrier invoices, written up tight. Unsubscribe with one click.